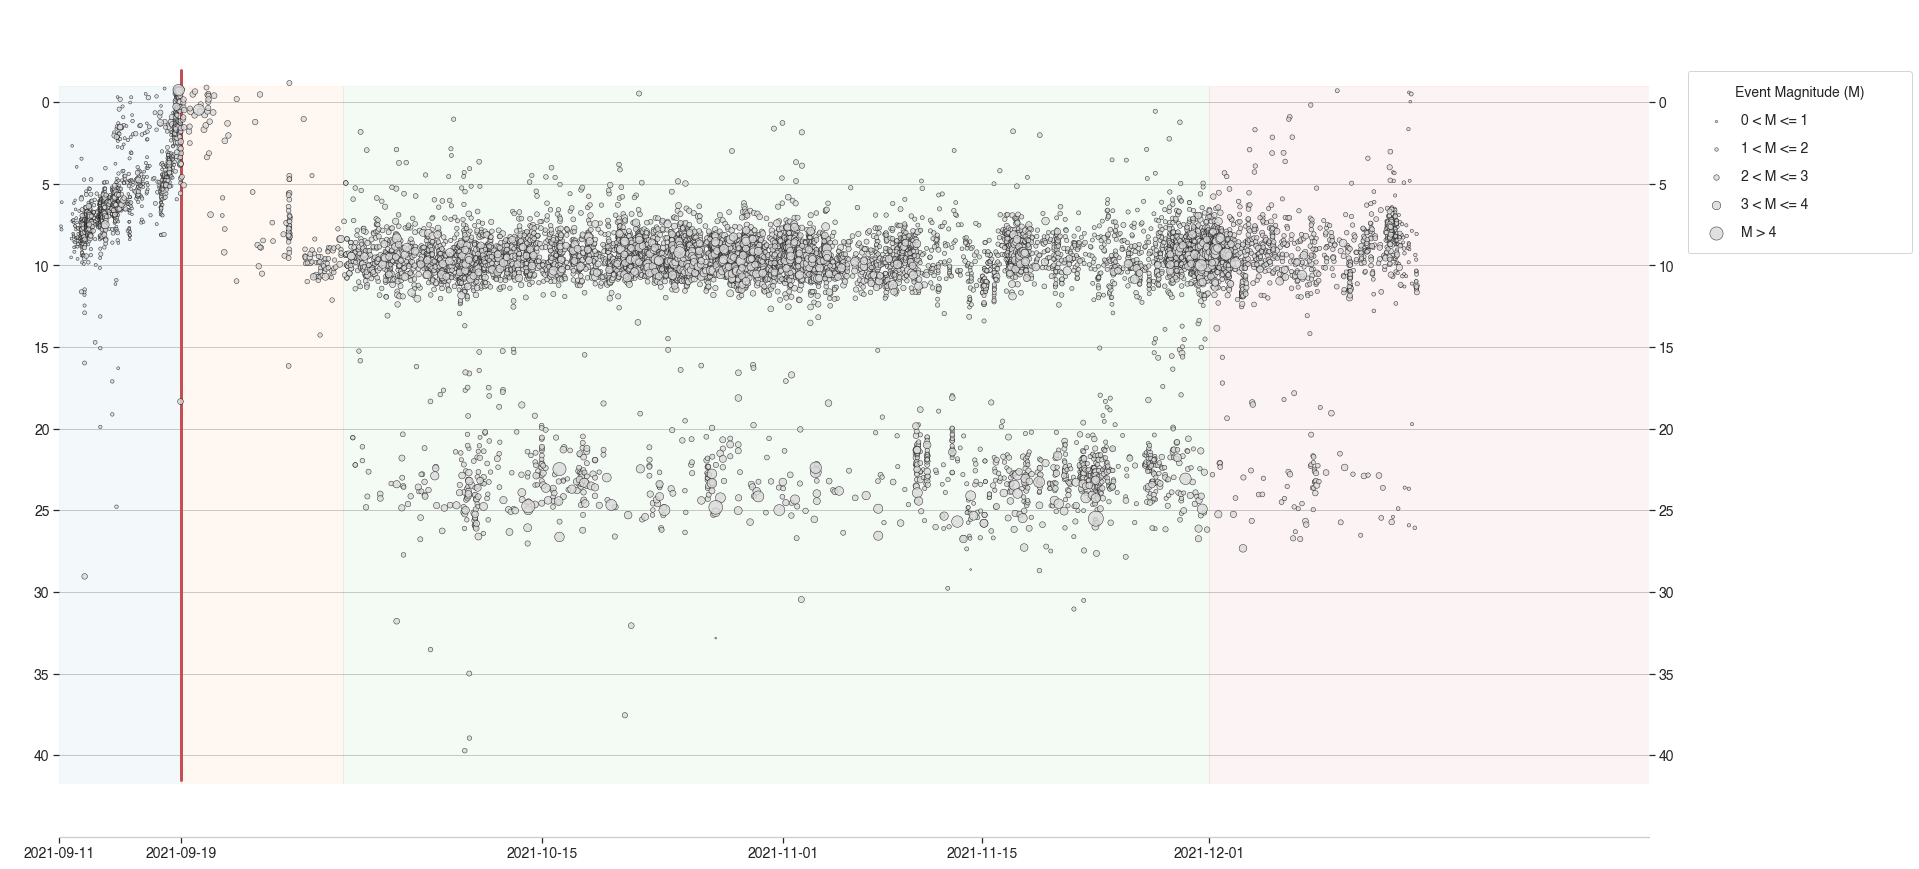
BAsed on learnings from the recent IAVCEI conference, there is an idea that there may be an offset or correlation between the intensity of deep and shallow earthquake swarms. Can we see this in the data we have?
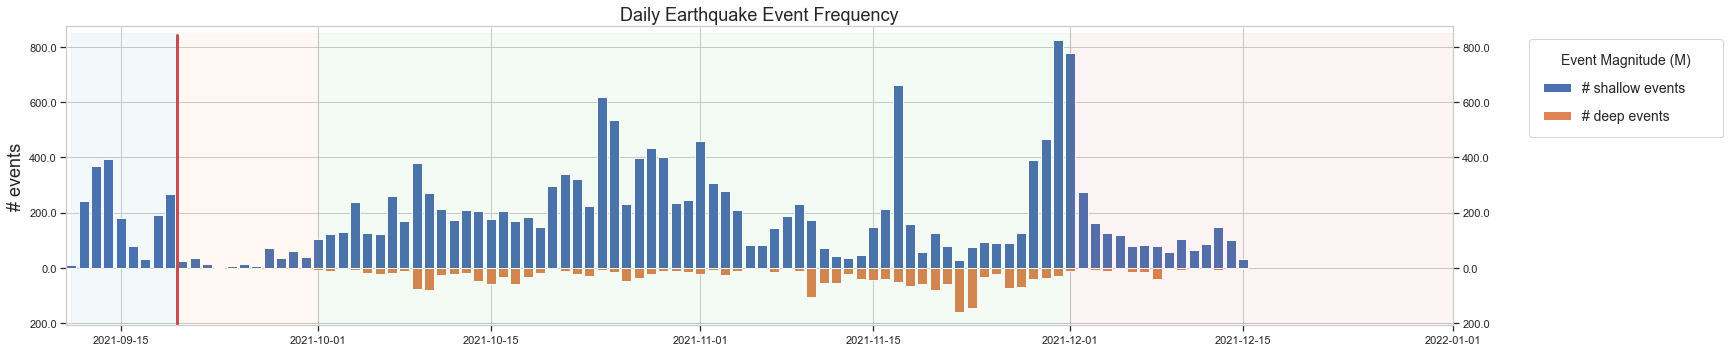
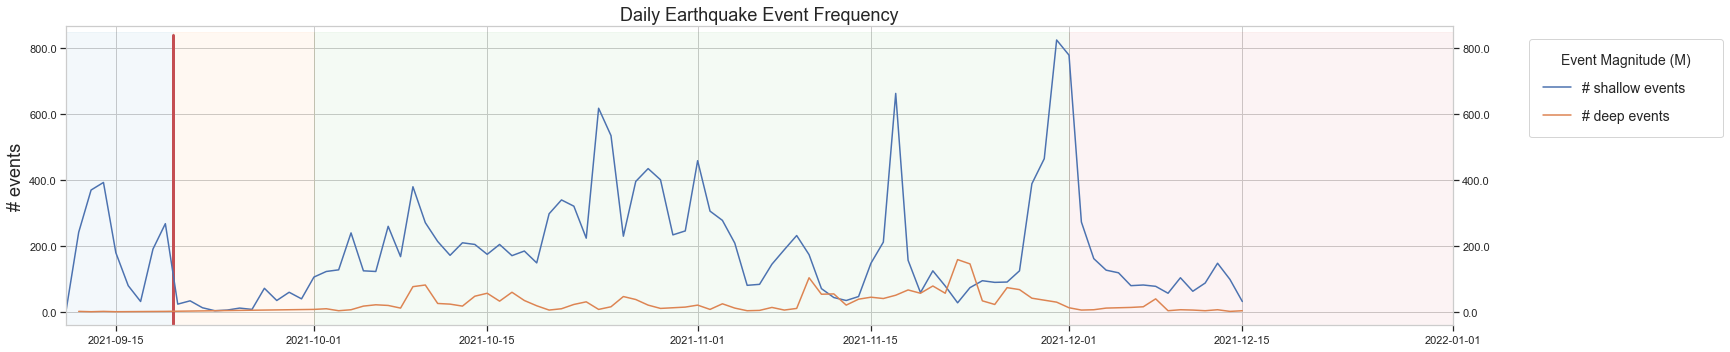
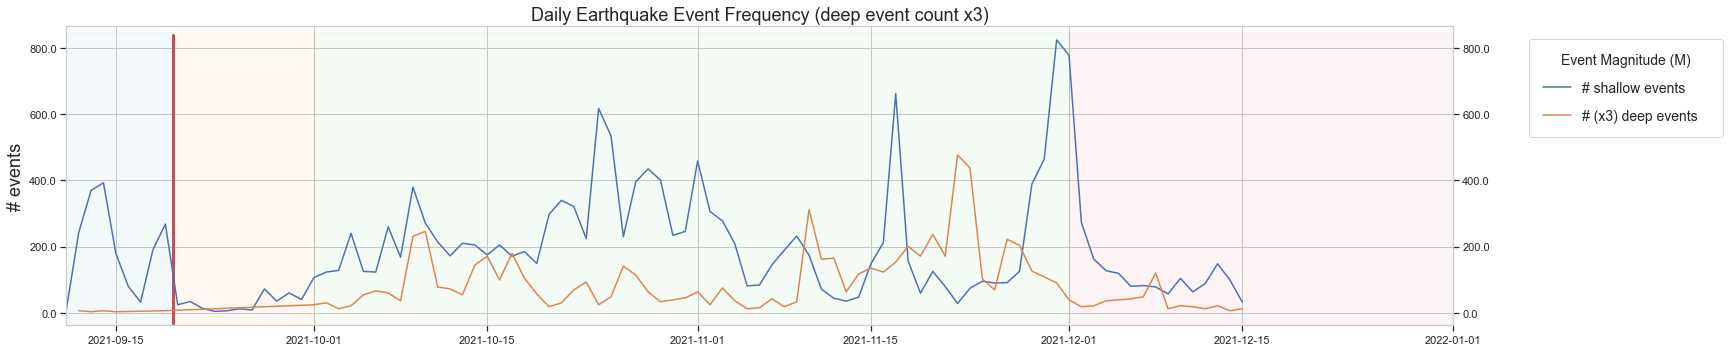
Let’s look at some histogram plots instead, in the next 3 plots data is aggregated into daily bins. Note Figure %s has the deep event count exaggerated, and is perhaps the best plot to use in comparing the peaks in intensity.