Data Screening
Load and review the data, check that dates are loaded properly and filter data down to the events in La Palma only. The dataset itself contains all recent IGN earthquake data for Spanish territory.
import pandas as pd
from igndata import load
import matplotlib.pyplot as plt
df = pd.read_csv('../catalogoComunSV_1653337721482.csv', sep=';', parse_dates=[1])
df.columns = ['Event', 'Date', 'Time', 'Latitude', 'Longitude', 'Depth(km)', 'Intensity','Magnitude', 'Type Mag', 'Location']
df['Time'] = df['Time'].str.strip()
df = df.sort_values(by=['Date', 'Time'], ascending=[False,False])
df.head()Loading...
df.describe()Loading...
plt.figure(figsize=(12,12))
ax = df.plot.scatter(x="Longitude", y="Latitude", figsize=(12,12), grid="on")
<Figure size 864x864 with 0 Axes>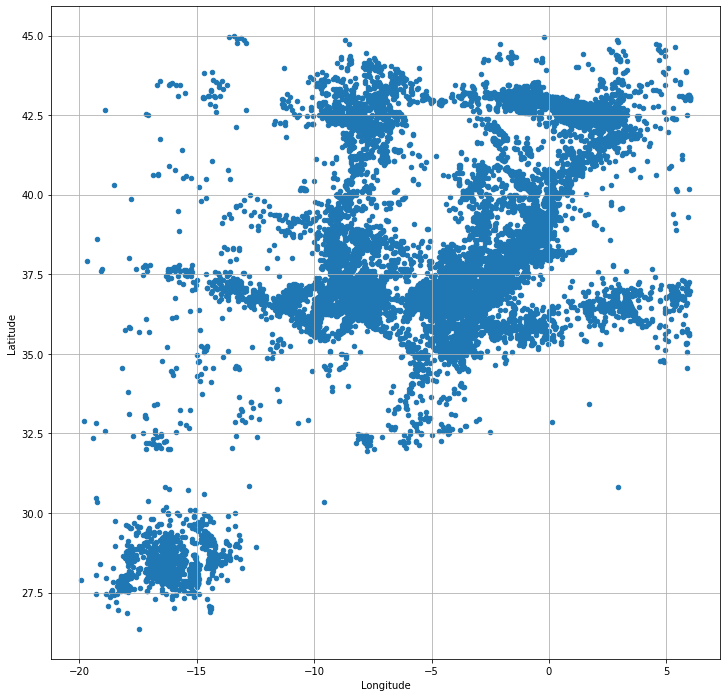
Filter down to La Palma events only
Also some rows seem to be missing depth measurements, (see differences in the count for columns above) - take only rows with valid depths
df = df[(df['Latitude'] < 28.7) & (df['Latitude'] > 28.3) & (df['Longitude'] < -17.7) & (df['Longitude'] > -18)]
df = df[df['Depth(km)'].notna()]
df.describe()
Loading...
plt.figure(figsize=(20,6))
plt.subplot(1,3,1)
df["Latitude"].plot.hist(bins=20, density=True)
df["Latitude"].plot.kde()
plt.subplot(1,3,2)
df["Longitude"].plot.hist(bins=20, density=True)
df["Longitude"].plot.kde()
plt.subplot(1,3,3)
df["Depth(km)"].plot.hist(bins=50, density=True)
_=df["Depth(km)"].plot.kde()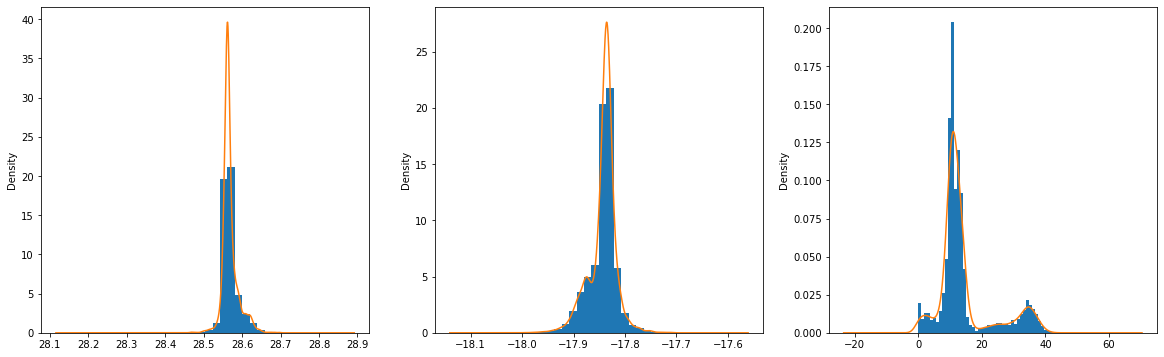
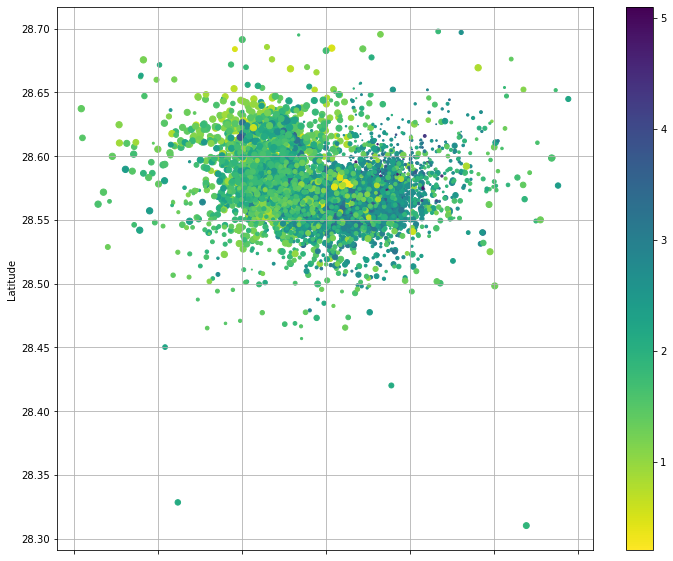
from matplotlib import cm
cmap = cm.get_cmap('viridis_r')
ax = df.plot.scatter(x="Longitude", y="Latitude", s=40-df["Depth(km)"], c=df["Magnitude"], figsize=(12,10), grid="on", cmap=cmap)
# ax.set_ylim((28.4, 28.9))
# ax.set_xlim((-18, -17.75))
/opt/homebrew/Caskroom/miniforge/base/envs/lapalma-earthquakes/lib/python3.10/site-packages/matplotlib/collections.py:982: RuntimeWarning: invalid value encountered in sqrt
scale = np.sqrt(self._sizes) * dpi / 72.0 * self._factor
df['Swarm'] = 0
df.loc[(df['Date'] >= '2017-10-01') & (df['Date'] <= '2017-10-31'), 'Swarm'] = 1
df.loc[(df['Date'] >= '2019-02-01') & (df['Date'] <= '2019-02-28'), 'Swarm'] = 2
df.loc[(df['Date'] >= '2020-07-21') & (df['Date'] <= '2020-08-05'), 'Swarm'] = 3
df.loc[(df['Date'] >= '2020-10-04') & (df['Date'] <= '2020-10-10'), 'Swarm'] = 4
df.loc[(df['Date'] >= '2020-10-11') & (df['Date'] <= '2020-10-22'), 'Swarm'] = 5
df.loc[(df['Date'] >= '2020-11-15') & (df['Date'] <= '2020-11-29'), 'Swarm'] = 6
df.loc[(df['Date'] >= '2020-12-10') & (df['Date'] <= '2020-12-29'), 'Swarm'] = 7
df.loc[(df['Date'] >= '2020-12-10') & (df['Date'] <= '2020-12-31'), 'Swarm'] = 8
df.loc[(df['Date'] >= '2021-01-15') & (df['Date'] <= '2021-02-07'), 'Swarm'] = 9
df.loc[(df['Date'] >= '2021-06-01') & (df['Date'] <= '2021-06-30'), 'Swarm'] = 10
df.loc[(df['Date'] >= '2021-07-01'), 'Swarm'] = 11


df['Phase'] = 0;
df.loc[(df['Date'] >= '2021-09-11') & (df['Date'] <= '2021-09-23'), 'Phase'] = 1
df.loc[(df['Date'] >= '2021-09-24') & (df['Date'] <= '2021-11-09'), 'Phase'] = 2
df.loc[(df['Date'] >= '2021-11-10') & (df['Date'] <= '2021-12-01'), 'Phase'] = 3
df.loc[(df['Date'] >= '2021-12-02') & (df['Date'] <= '2021-12-13'), 'Phase'] = 4
df.loc[(df['Date'] >= '2021-12-14'), 'Phase'] = 5
df.to_csv("./lapalma_update.csv", index=False)