Visualization of La Palma Earthquake Data
Using the subset of IGN data specific to La Palma. This subset was prepared using screening.ipynb and saved to lapalma.csv.
import pandas as pd
import altair as alt
alt.data_transformers.enable('default', max_rows=None)
import numpy as np
df = pd.read_csv('./lapalma.csv')df['Datetime'] = (df['Date'] + ' ' + df['UTC time']).apply(pd.to_datetime, format='%Y-%m-%d %H:%M:%S')
df.head()Loading...
df.describe()Loading...
df['Depth'] = 'Crustal (<20km)'
df.loc[df['Depth(km)'] >= 20, 'Depth'] = 'Mantle (>20km)'
brush = alt.selection_interval(encodings=['x'])
bars = alt.Chart(df, width=700, height=150).mark_bar().encode(
x=alt.X('Date:T', axis=alt.Axis(labelAngle=-45)),
y=alt.Y('count():Q', title='Number of Events', axis=alt.Axis(labelAngle=-45)),
color=alt.condition(brush, 'Depth:N', alt.value('lightgray'))
).properties(
title='Earthquake event magnitude since 11 Sep 2021'
).add_selection(
brush
)
detail_scatter = alt.Chart(df, width=700, height=350).mark_circle(opacity=0.3, strokeOpacity=1.0).encode(
x=alt.X('Datetime:T', axis=alt.Axis(labelAngle=-45)),
y=alt.Y('Depth(km):Q', axis=alt.Axis(labelAngle=-45),scale=alt.Scale(domain=[45, 0])),
color=alt.condition(brush, 'Depth:N', alt.value('lightgray'), scale=alt.Scale(scheme='category10')),
size=alt.Size('Magnitude:Q', scale=alt.Scale(type='log', domain=[1.5,6], range=[2,200]))
).properties(
title='Number of Earthquakes per day since 11 Sep 2021'
).transform_filter(brush)
detail_scatter & barsLoading...
brush = alt.selection_interval(encodings=['x'])

bars = alt.Chart(df, width=700, height=150).mark_bar().encode(
    x=alt.X('Date:T', axis=alt.Axis(labelAngle=-45)),
    y=alt.Y('count():Q', title='Number of Events', axis=alt.Axis(labelAngle=-45)),
    color=alt.condition(brush, 'Depth:N', alt.value('lightgray'))
).properties(
    title='Number of Earthquakes per day since 11 Sep 2021'
).add_selection(
    brush
)


detail_scatter = alt.Chart(df, width=700, height=500).mark_circle(opacity=0.3, strokeOpacity=1.0).encode(
    x=alt.X('Magnitude:Q', title='magnitude', axis=alt.Axis(labelAngle=-45), scale=alt.Scale(domain=[1.5, 6])),
    y=alt.Y('Depth(km):Q', axis=alt.Axis(labelAngle=-45),scale=alt.Scale(domain=[45, 0])),
    color=alt.condition(brush, 'Depth:N', alt.value('lightgray')),
    size=alt.Size('Magnitude:Q', scale=alt.Scale(type='log', domain=[1.5,6], range=[2,200]))
).properties(
    title='Number of Earthquakes per day since 11 Sep 2021'
).transform_filter(brush)


detail_scatter & bars
Loading...
brush = alt.selection_interval(encodings=['x'])

total_width = 1200
scatter_height = 500

bars = alt.Chart(df, width=total_width, height=150).mark_bar().encode(
    x=alt.X('Date:T', axis=alt.Axis(labelAngle=-45)),
    y=alt.Y('count():Q', title='Number of Events', axis=alt.Axis(labelAngle=-45)),
    color=alt.condition(brush, 'Depth:N', alt.value('lightgray'))
).properties(
    title='Number of Earthquakes per day since 11 Sep 2021'
).add_selection(
    brush
)


detail_scatter_long = alt.Chart(df, width=total_width/2, height=scatter_height).mark_circle(opacity=0.3, strokeOpacity=1.0).encode(
    x=alt.X('Longitude:Q', title='Longitude', axis=alt.Axis(labelAngle=-45),scale=alt.Scale(domain=[-18, -17.7])),
    y=alt.Y('Depth(km):Q', axis=alt.Axis(labelAngle=-45),scale=alt.Scale(domain=[45, 0])),
    size=alt.Size('Magnitude:Q', scale=alt.Scale(type='log', domain=[1.5,6], range=[2,200]))
).properties(
    title='Number of Earthquakes per day since 11 Sep 2021'
).transform_filter(brush)

detail_scatter_lat = alt.Chart(df, width=total_width/2, height=scatter_height).mark_circle(opacity=0.3, strokeOpacity=1.0).encode(
    x=alt.X('Latitude:Q', title='Latitude', axis=alt.Axis(labelAngle=-45),scale=alt.Scale(domain=[28.4, 28.7])),
    y=alt.Y('Depth(km):Q', axis=alt.Axis(labelAngle=-45),scale=alt.Scale(domain=[45, 0])),
    color=alt.Color('Magnitude:Q'),
    size=alt.Size('Magnitude:Q', scale=alt.Scale(type='log', domain=[1.5,5], range=[2,200]))
).properties(
    title='Number of Earthquakes per day since 11 Sep 2021'
).transform_filter(brush)


( detail_scatter_long | detail_scatter_lat ) & bars
Loading...
import math
import matplotlib.pyplot as plt

angle_to_north = -25*(math.pi/180)
s = np.array([math.sin(angle_to_north), math.cos(angle_to_north)])

def project(sn, x):
    return sn * (np.dot(x, sn) / np.dot(sn, sn))


lat = np.linspace(-5, 5, 11)
lng = np.linspace(-5, 5, 11)
# full coorindate arrays
llng, llat = np.meshgrid(lng, lat, indexing='xy')

plt.scatter(llng, llat)

points = np.stack((llng.flatten(),llat.flatten()), axis=1)
ppts = [project(s,points[n,:]) for n in range(0,points.shape[0]) ]

llng, llat = np.stack(ppts, axis=1)

plt.scatter(llng, llat, color='r')
<matplotlib.collections.PathCollection at 0x137afd3f0>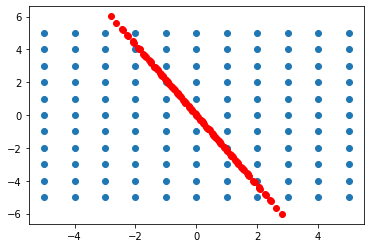
# remote geojson data object
url_geojson = 'https://raw.githubusercontent.com/mattijn/datasets/master/two_polygons.geo.json'
data_geojson_remote = alt.Data(url=url_geojson, format=alt.DataFormat(property='features',type='json'))

# chart object
alt.Chart(data_geojson_remote).mark_geoshape(
).encode(
    color="properties.name:N"
).project(
    type='identity', reflectY=True
)
Loading...